Perspective
5 Fleet Utilization Metrics Every Rental Company Should Track in 2026
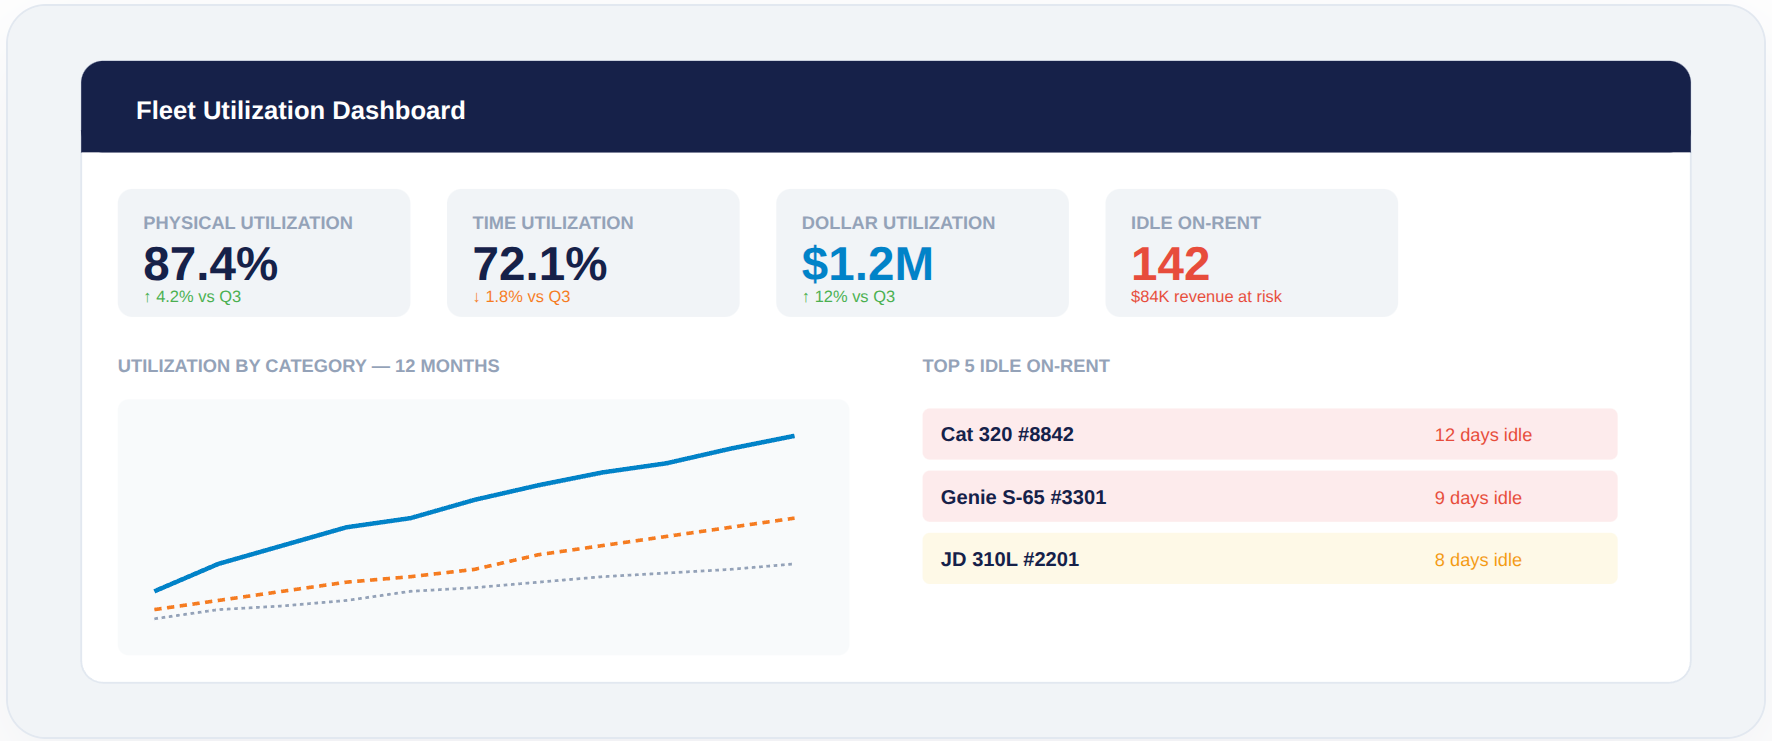
If you run a rental company, you probably track utilization. It's the number your board asks about, the metric your ops team watches daily, and the stat your sales team quotes on every call. But here's the uncomfortable truth: most rental companies track utilization in ways that feel productive but don't actually change behavior.
After working with rental fleets ranging from 500 to 26,000+ assets, we've identified five utilization metrics that consistently separate the companies making data-driven decisions from the ones drowning in dashboards.
1. Physical Utilization vs. Time Utilization
Most companies track one number: "percentage of fleet on rent." That's physical utilization — how many of your assets are currently deployed. It's important, but it only tells half the story.
Time utilization measures how many hours your deployed assets are actually running. An excavator sitting on a job site for 30 days but only operating 4 hours a day has high physical utilization (it's "on rent") but terrible time utilization. That distinction matters because it reveals whether your customers are actually using what they're paying for — and whether you could be deploying those assets more efficiently.
An asset that's on rent but not running is generating revenue today but eroding your competitive position tomorrow. The customer will eventually notice they're paying for idle iron.
2. Dollar Utilization — The Metric Your CFO Actually Cares About
Physical utilization treats a $15,000/month excavator the same as a $800/month light tower. Dollar utilization weights each asset by its rental revenue, giving you a true picture of how effectively your revenue-generating capacity is being used.
A fleet can run at 85% physical utilization and still show dollar utilization in the sixties — meaning the most expensive equipment is sitting idle while cheap assets are deployed. That's a portfolio problem, not a utilization problem, and it only shows up when you measure in dollars.
3. Idle-on-Rent — The Silent Revenue Killer
This is the metric that changes behavior fastest. Idle-on-rent measures assets that are currently on an active rental contract but haven't moved or operated in 7+ days. These assets are generating revenue — for now — but they're also a leading indicator of customer dissatisfaction, upcoming off-rent calls, and potential contract disputes.
Consider what that costs. On a fleet of 1,800 units, suppose 8% are idle on rent and the average unit bills $600 a month. That's roughly $86,000 in monthly revenue sitting on contracts the customer has already stopped needing — revenue that ends with an off-rent call you didn't see coming, or a credit request you can't easily refuse. The arithmetic is hypothetical, but the pattern is not: assets go quiet weeks before anyone calls to return them.
4. Category-Level Utilization Trends
Overall utilization is a vanity metric. What matters is utilization by equipment category — and how it's trending over time. If your excavator utilization is climbing while your aerial utilization is dropping, that's a signal about market demand, not operational efficiency.
Tracking category-level trends over 6–12 months tells you where to invest in new iron, where to reduce inventory, and which categories need pricing adjustments. It's the difference between reactive fleet planning and proactive portfolio management.
5. Utilization-to-Maintenance Ratio
The final metric connects utilization to asset health. High-utilization assets that are also high-maintenance-cost assets are destroying your margins even though they look productive on paper. Conversely, low-utilization assets with low maintenance costs might be your most profitable equipment per deployed hour.
By tracking the ratio of utilization to maintenance cost per asset, you can identify which machines are earning their keep and which ones should be sold, redeployed, or retired. This is where fleet intelligence — combining operational data with financial data — becomes essential.
The goal isn't to maximize utilization. It's to maximize the return on every asset in your fleet. Sometimes that means running a machine less, not more.
What This Means for Your Operation
If you're only tracking physical utilization today, you're seeing roughly 20% of the picture. Adding time utilization, dollar utilization, idle-on-rent monitoring, category trends, and utilization-to-maintenance ratios gives you the full view — and more importantly, it gives you actionable intelligence that drives real decisions.
This is exactly what we built Incus5 to do. The platform unifies your telematics, ERP, and operational data so you can see all five of these metrics in real time, across every asset, without building a single spreadsheet.
If you're ready to move beyond basic utilization tracking, request a demo and we'll show you what these metrics look like with your data.
Key takeaways
- Physical utilization alone measures whether an asset is on rent, not whether it is earning.
- Dollar utilization ties revenue to fleet value, and it is the metric finance teams act on.
- Idle-on-rent identifies assets that are billing but not working, often the fastest recoverable revenue in a fleet.
- Utilization becomes actionable only when it can be viewed by category, branch and asset class.
- Comparing utilization against maintenance load shows which assets earn enough to justify what they cost.
Frequently asked questions
What is the difference between physical and time utilization?
Physical utilization measures the share of a fleet that is on rent at a point in time. Time utilization measures how many days each unit was on rent across a period. Physical utilization is a snapshot; time utilization shows patterns over weeks or months, which is what reveals seasonality and chronically underused assets.
What is dollar utilization?
Dollar utilization compares rental revenue over a period against the original cost or current value of the fleet. It answers whether the capital tied up in equipment is earning a return. Unlike physical utilization it accounts for rate as well as volume, so a fleet can look busy and still show weak dollar utilization.
What does idle-on-rent mean?
Idle-on-rent describes equipment that is out on a rental contract and billing, but showing little or no engine hours. It usually means the customer no longer needs the unit. Identifying it early lets a rental company recover the asset and redeploy it rather than leaving it parked on a job site.
How often should rental companies review utilization?
Weekly review works for operational decisions such as redeployment and off-rent follow-up, since those depend on current conditions. Monthly or quarterly review suits financial metrics like dollar utilization, where short-term movement is mostly noise. The cadence matters less than consistency and having the underlying data in one place.
Can utilization be tracked on equipment without telematics?
Yes, though the data differs. Assets without telematics have no engine hours, so utilization has to come from contract and rental management records rather than machine data. Combining both sources gives a complete fleet view, which is why platforms that read from ERP systems as well as telematics can cover the whole yard.